Step 8. Build your first custom dashboard
In previous steps of the guide, you have learned how several sections of the Netdata dashboard worked.
This step will show you how to set up a custom dashboard to fit your unique needs. If nothing else, Netdata is really, really flexible. 🤸
What you'll learn in this step
In this step of the Netdata guide, you'll learn:
- Why you might want a custom dashboard
- How to create and prepare your
custom-dashboard.htmlfile - Where to add
dashboard.jsto your custom dashboard file - How to add basic styling
- How to add charts of different types, shapes, and sizes
Let's get on with it!
Why should I create a custom dashboard?
Because it's cool!
But there are way more reasons than that, most of which will prove more valuable to you.
You could use custom dashboards to aggregate real-time data from multiple Netdata agents in one place. Or, you could put
all the charts with metrics collected from your custom application via statsd and perform application performance
monitoring from a single dashboard. You could even use a custom dashboard and a standalone web server to create an
enriched public status page for your service, and give your users something fun to look at while they're waiting for the
503 errors to clear up!
Netdata's custom dashboarding capability is meant to be as flexible as your ideas. We hope you can take these fundamental ideas and turn them into something amazing.
Create and prepare your custom-dashboard.html file
By default, Netdata stores its web server files at /usr/share/netdata/web. As with finding the location of your
netdata.conf file, you can double-check this location by loading up http://HOST:19999/netdata.conf in your browser
and finding the value of the web files directory option.
To create your custom dashboard, create a file at /usr/share/netdata/web/custom-dashboard.html and copy in the
following:
<!DOCTYPE html>
<html lang="en">
<head>
  <title>My custom dashboard</title>

  <meta http-equiv="Content-Type" content="text/html; charset=utf-8" />
  <meta charset="utf-8">
  <meta http-equiv="X-UA-Compatible" content="IE=edge,chrome=1">
  <meta name="viewport" content="width=device-width, initial-scale=1">
  <meta name="apple-mobile-web-app-capable" content="yes">
  <meta name="apple-mobile-web-app-status-bar-style" content="black-translucent">

  <!-- Add dashboard.js here! -->

</head>
<body>

  <main class="container">

    <h1>My custom dashboard</h1>

    <!-- Add charts here! -->

  </main>

</body>
</html>
Try visiting http://HOST:19999/custom-dashboard.html in your browser.
If you get a blank page with this text: Access to file is not permitted: /usr/share/netdata/web/custom-dashboard.html.
You can fix this error by changing the dashboard file's permissions to make it owned by the netdata user.
sudo chown netdata:netdata /usr/share/netdata/web/custom-dashboard.html
Reload your browser, and you should see a blank page with the title: Your custom dashboard!
Add dashboard.js to your custom dashboard file
You need to include the dashboard.js file of a Netdata agent to add Netdata charts. Add the following to the <head>
of your custom dashboard page and change HOST according to your setup.
  <!-- Add dashboard.js here! -->
  <script type="text/javascript" src="http://HOST:19999/dashboard.js"></script>
When you add dashboard.js to any web page, it loads several JavaScript and CSS files to create and style charts. It
also scans the page for elements that define charts, builds them, and refreshes with new metrics.
If you enabled SSL on your Netdata dashboard already, you'll need to use
https://to grab thedashboard.jsfile.
Add some basic styling
While not necessary, let's add some basic styling to make our dashboard look a little nicer. We're putting some
basic CSS into a <style> tag inside of the page's <head> element.
  <!-- Add dashboard.js here! -->
  <script type="text/javascript" src="http://HOST:19999/dashboard.js"></script>

  <style>
    .wrap {
      max-width: 1280px;
      margin: 0 auto;
    }

    h1 {
      margin-bottom: 30px;
      text-align: center;
    }

    .charts {
      display: flex;
      flex-flow: row wrap;
      justify-content: space-around;
    }
  </style>

</head>
Creating your dashboard's charts
Time to create a chart!
You need to create a <div> for each new chart. Each <div> element accepts a few data- attributes, some of which
are required and some of which are optional.
Let's cover a few important ones. And while we do it, we'll create a custom dashboard that shows a few CPU-related charts on a single page.
The chart unique ID (required)
You need to specify the unique ID of a chart to show it on your custom dashboard. If you forgot how to find the unique ID, head back over to step 2 for a re-introduction.
You can then put this unique ID into a <div> element with the data-netdata attribute. Put this in the <body> of
your custom dashboard file beneath the helpful comment.
<body>

  <main class="wrap">

    <h1>My custom dashboard</h1>

    <div class="charts">

      <!-- Add charts here! -->
      <div data-netdata="system.cpu"></div>

    </div>

  </main>

</body>
Reload the page, and you should see a real-time system.cpu chart!
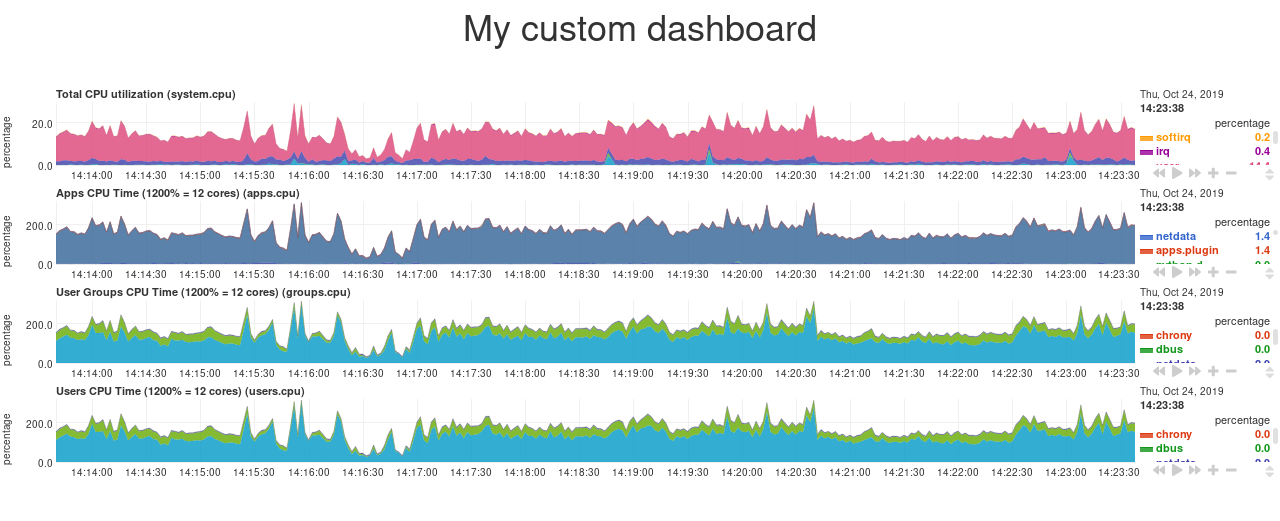
... and a whole lot of white space. Let's fix that by adding a few more charts.
      <!-- Add charts here! -->
      <div data-netdata="system.cpu"></div>
      <div data-netdata="apps.cpu"></div>
      <div data-netdata="groups.cpu"></div>
      <div data-netdata="users.cpu"></div>
Set chart duration
By default, these charts visualize 10 minutes of Netdata metrics. Let's get a little more granular on this dashboard. To
do so, add a new data-after="" attribute to each chart.
data-after takes a relative number of seconds from now. So, by putting -300 as the value, you're asking the
custom dashboard to display the last 5 minutes (5m * 60s = 300s) of data.
      <!-- Add charts here! -->
      <div data-netdata="system.cpu"
           data-after="-300">
      </div>
      <div data-netdata="apps.cpu"
           data-after="-300">
      </div>
      <div data-netdata="groups.cpu"
           data-after="-300">
      </div>
      <div data-netdata="users.cpu"
           data-after="-300">
      </div>
Set chart size
You can set the size of any chart using the data-height="" and data-width="" attributes. These attributes can be
anything CSS accepts for width and height (e.g. percentages, pixels, em/rem, calc, and so on).
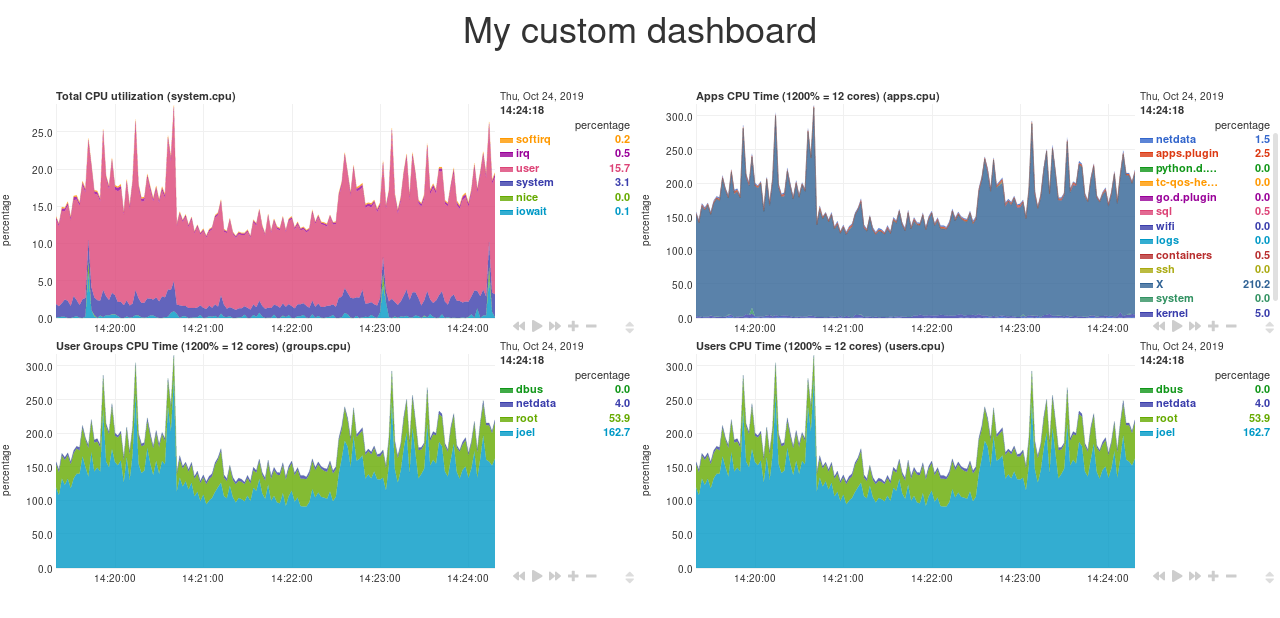
Let's make the charts a little taller and allow them to fit side-by-side for a more compact view. Add
data-height="200px" and data-width="50%" to each chart.
      <div data-netdata="system.cpu"
           data-after="-300"
           data-height="250px"
           data-width="50%"></div>
      <div data-netdata="apps.cpu"
           data-after="-300"
           data-height="250px"
           data-width="50%"></div>
      <div data-netdata="groups.cpu"
           data-after="-300"
           data-height="250px"
           data-width="50%"></div>
      <div data-netdata="users.cpu"
           data-after="-300"
           data-height="250px"
           data-width="50%"></div>
Now we're getting somewhere!
Final touches
While we already have a perfectly workable dashboard, let's add some final touches to make it a little more pleasant on the eyes.
First, add some extra CSS to create some vertical whitespace between the top and bottom row of charts.
    <style>
    ...

    .charts > div {
      margin-bottom: 6rem;
    }
   </style>
To create horizontal whitespace, change the value of data-width="50%" to data-width="calc(50% - 2rem)".
      <div data-netdata="system.cpu"
           data-after="-300"
           data-height="250px"
           data-width="calc(50% - 2rem)"></div>
      <div data-netdata="apps.cpu"
           data-after="-300"
           data-height="250px"
           data-width="calc(50% - 2rem)"></div>
      <div data-netdata="groups.cpu"
           data-after="-300"
           data-height="250px"
           data-width="calc(50% - 2rem)"></div>
      <div data-netdata="users.cpu"
           data-after="-300"
           data-height="250px"
           data-width="calc(50% - 2rem)"></div>
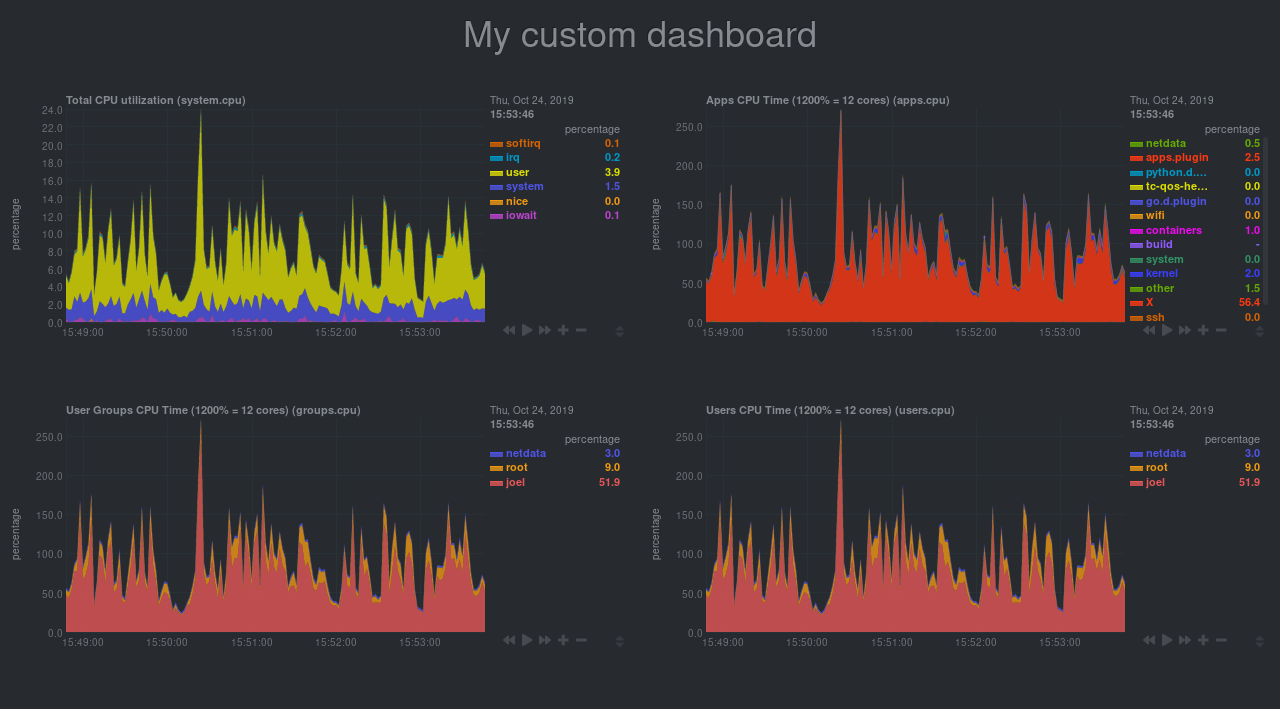
Told you the data-width and data-height attributes can take any CSS values!
Prefer a dark theme? Add this to your <head> above where you added dashboard.js:
  <script>
    var netdataTheme = 'slate';
  </script>

  <!-- Add dashboard.js here! -->
  <script type="text/javascript" src="https://HOST/dashboard.js"></script>
Refresh the dashboard to give your eyes a break from all that blue light!
The final custom-dashboard.html
In case you got lost along the way, here's the final version of the custom-dashboard.html file:
<!DOCTYPE html>
<html lang="en">
<head>
  <title>My custom dashboard</title>

  <meta http-equiv="Content-Type" content="text/html; charset=utf-8" />
  <meta charset="utf-8">
  <meta http-equiv="X-UA-Compatible" content="IE=edge,chrome=1">
  <meta name="viewport" content="width=device-width, initial-scale=1">
  <meta name="apple-mobile-web-app-capable" content="yes">
  <meta name="apple-mobile-web-app-status-bar-style" content="black-translucent">

  <script>
    var netdataTheme = 'slate';
  </script>

  <!-- Add dashboard.js here! -->
  <script type="text/javascript" src="http://localhost:19999/dashboard.js"></script>

  <style>
    .wrap {
      max-width: 1280px;
      margin: 0 auto;
    }

    h1 {
      margin-bottom: 30px;
      text-align: center;
    }

    .charts {
      display: flex;
      flex-flow: row wrap;
      justify-content: space-around;
    }

    .charts > div {
      margin-bottom: 6rem;
      position: relative;
    }
   </style>

</head>
<body>

  <main class="wrap">

    <h1>My custom dashboard</h1>

    <div class="charts">

      <!-- Add charts here! -->
      <div data-netdata="system.cpu"
           data-after="-300"
           data-height="250px"
           data-width="calc(50% - 2rem)"></div>
      <div data-netdata="apps.cpu"
           data-after="-300"
           data-height="250px"
           data-width="calc(50% - 2rem)"></div>
      <div data-netdata="groups.cpu"
           data-after="-300"
           data-height="250px"
           data-width="calc(50% - 2rem)"></div>
      <div data-netdata="users.cpu"
           data-after="-300"
           data-height="250px"
           data-width="calc(50% - 2rem)"></div>

    </div>

  </main>

</body>
</html>
What's next?
In this guide, you learned the fundamentals of building a custom Netdata dashboard. You should now be able to add more
charts to your custom-dashboard.html, change the charts that are already there, and size them according to your needs.
Of course, the custom dashboarding features covered here are just the beginning. Be sure to read up on our custom dashboard documentation for details on how you can use other chart libraries, pull metrics from multiple Netdata agents, and choose which dimensions a given chart shows.
Next, you'll learn how to store long-term historical metrics in Netdata!
Was this page helpful?
Need further help?
Search for an answer in our community forum.
Contribute
- Join our community forum
- Learn how to contribute to Netdata's open-source project
- Submit a feature request