Step 3. Monitor more than one system with Netdata
The Netdata agent is distributed by design. That means each agent operates independently from any other, collecting and creating charts only for the system you installed it on. We made this decision a long time ago to improve security and performance.
You might be thinking, "So, now I have to remember all these IP addresses, and type them into my browser manually, to move from one system to another? Maybe I should just make a bunch of bookmarks. What's a few more tabs on top of the hundred I have already?"
We get it. That's why we built Netdata Cloud, which connects many distributed agents for a seamless experience when monitoring an entire infrastructure of Netdata-monitored nodes.

What you'll learn in this step
In this step of the Netdata guide, we'll talk about the following:
- Why you should use Netdata Cloud
- Get started with Netdata Cloud
- Navigate between dashboards with Visited Nodes
Why use Netdata Cloud?
Our Cloud documentation does a good job (we think!) of explaining why Cloud gives you a ton of value at no cost:
Netdata Cloud gives you real-time visibility for your entire infrastructure. With Netdata Cloud, you can run all your distributed Agents in headless mode and access the real-time metrics and insightful charts from their dashboards. View key metrics and active alarms at-a-glance, and then seamlessly dive into any of your distributed dashboards without leaving Cloud's centralized interface.
You can add as many nodes and team members as you need, and as our free and open source Agent gets better with more features, new collectors for more applications, and improved UI, so will Cloud.
Get started with Netdata Cloud
Signing in, onboarding, and connecting your first nodes only takes a few minutes, and we have a Get started with Cloud guide to help you walk through every step.
Or, if you're feeling confident, dive right in.
When you finish that guide, circle back to this step in the guide to learn how to use the Visited Nodes feature on top of Cloud's centralized web interface.
Navigate between dashboards with Visited Nodes
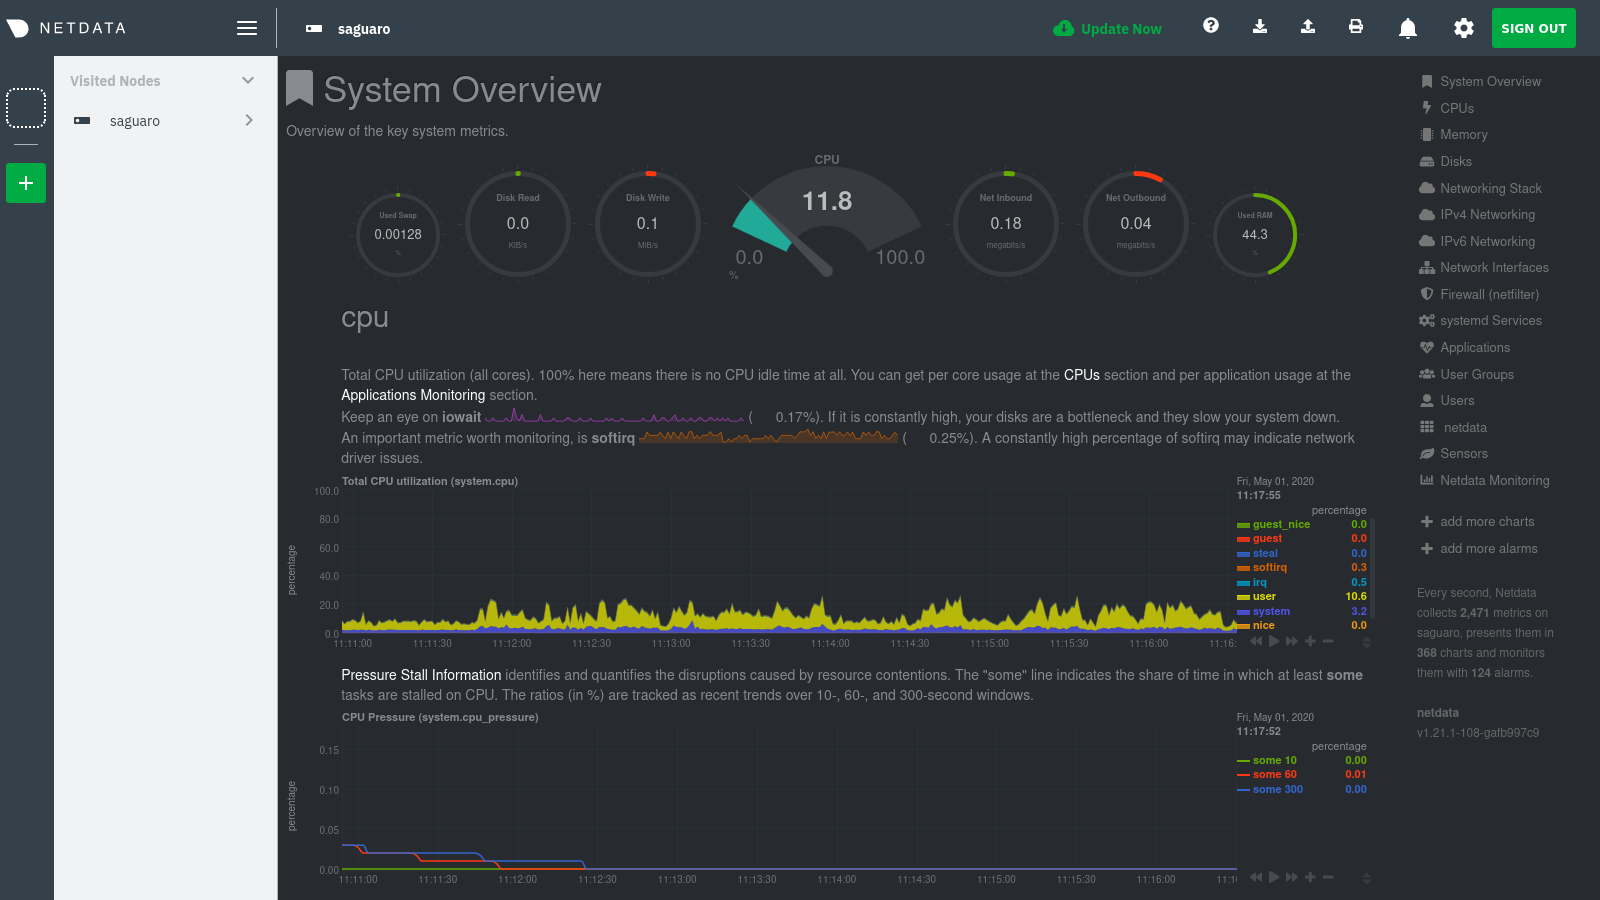
To add nodes to your visited nodes, you first need to navigate to that node's dashboard, then click the Sign in button at the top of the dashboard. On the screen that appears, which states your node is requesting access to your Netdata Cloud account, sign in with your preferred method.
Cloud redirects you back to your node's dashboard, which is now connected to your Netdata Cloud account. You can now see the menu populated by a single visited node.
If you previously went through the Cloud onboarding process to create a Space and War Room, you will also see these alongside your visited nodes. You can click on your Space or any of your War Rooms to navigate to Netdata Cloud and continue monitoring your infrastructure from there.
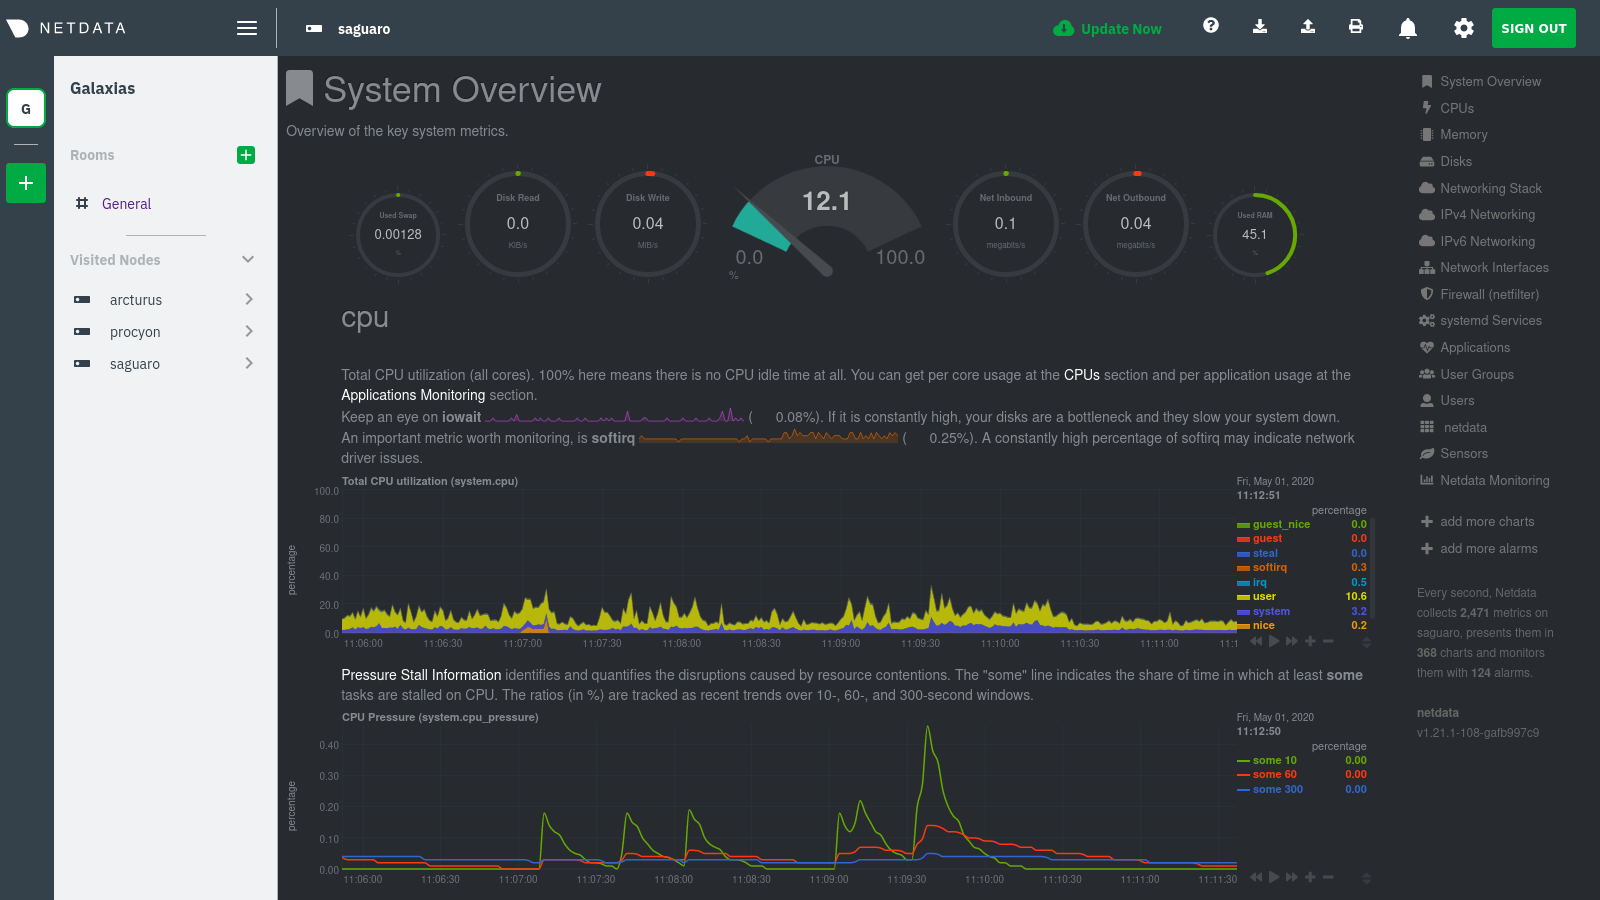
To add other visited nodes, navigate to their dashboard and sign in to Cloud by clicking on the Sign in button. This process connects that node to your Cloud account and further populates the menu.
Once you've added more than one node, you can use the menu to switch between various dashboards without remembering IP addresses or hostnames or saving bookmarks for every node you want to monitor.
What's next?
Now that you have a Netdata Cloud account with a connected node (or a few!) and can navigate between your dashboards with Visited nodes, it's time to learn more about how you can configure Netdata to your liking. From there, you'll be able to customize your Netdata experience to your exact infrastructure and the information you need.
Was this page helpful?
Need further help?
Search for an answer in our community forum.
Contribute
- Join our community forum
- Learn how to contribute to Netdata's open-source project
- Submit a feature request