War Rooms
War Rooms organize your connected nodes and provide infrastructure-wide dashboards using real-time metrics and visualizations.
Once you add nodes to a War Room, you can then use various dashboards to monitor the health and performance of your entire infrastructure from a single pane of glass. When an anomaly strikes, drill down into single-node dashboards for every granular detail you need for root cause analysis.
Navigating a War Room
Every War Room has the same dashboards, navigation, indicators, and management tools.
Switching between dashboards
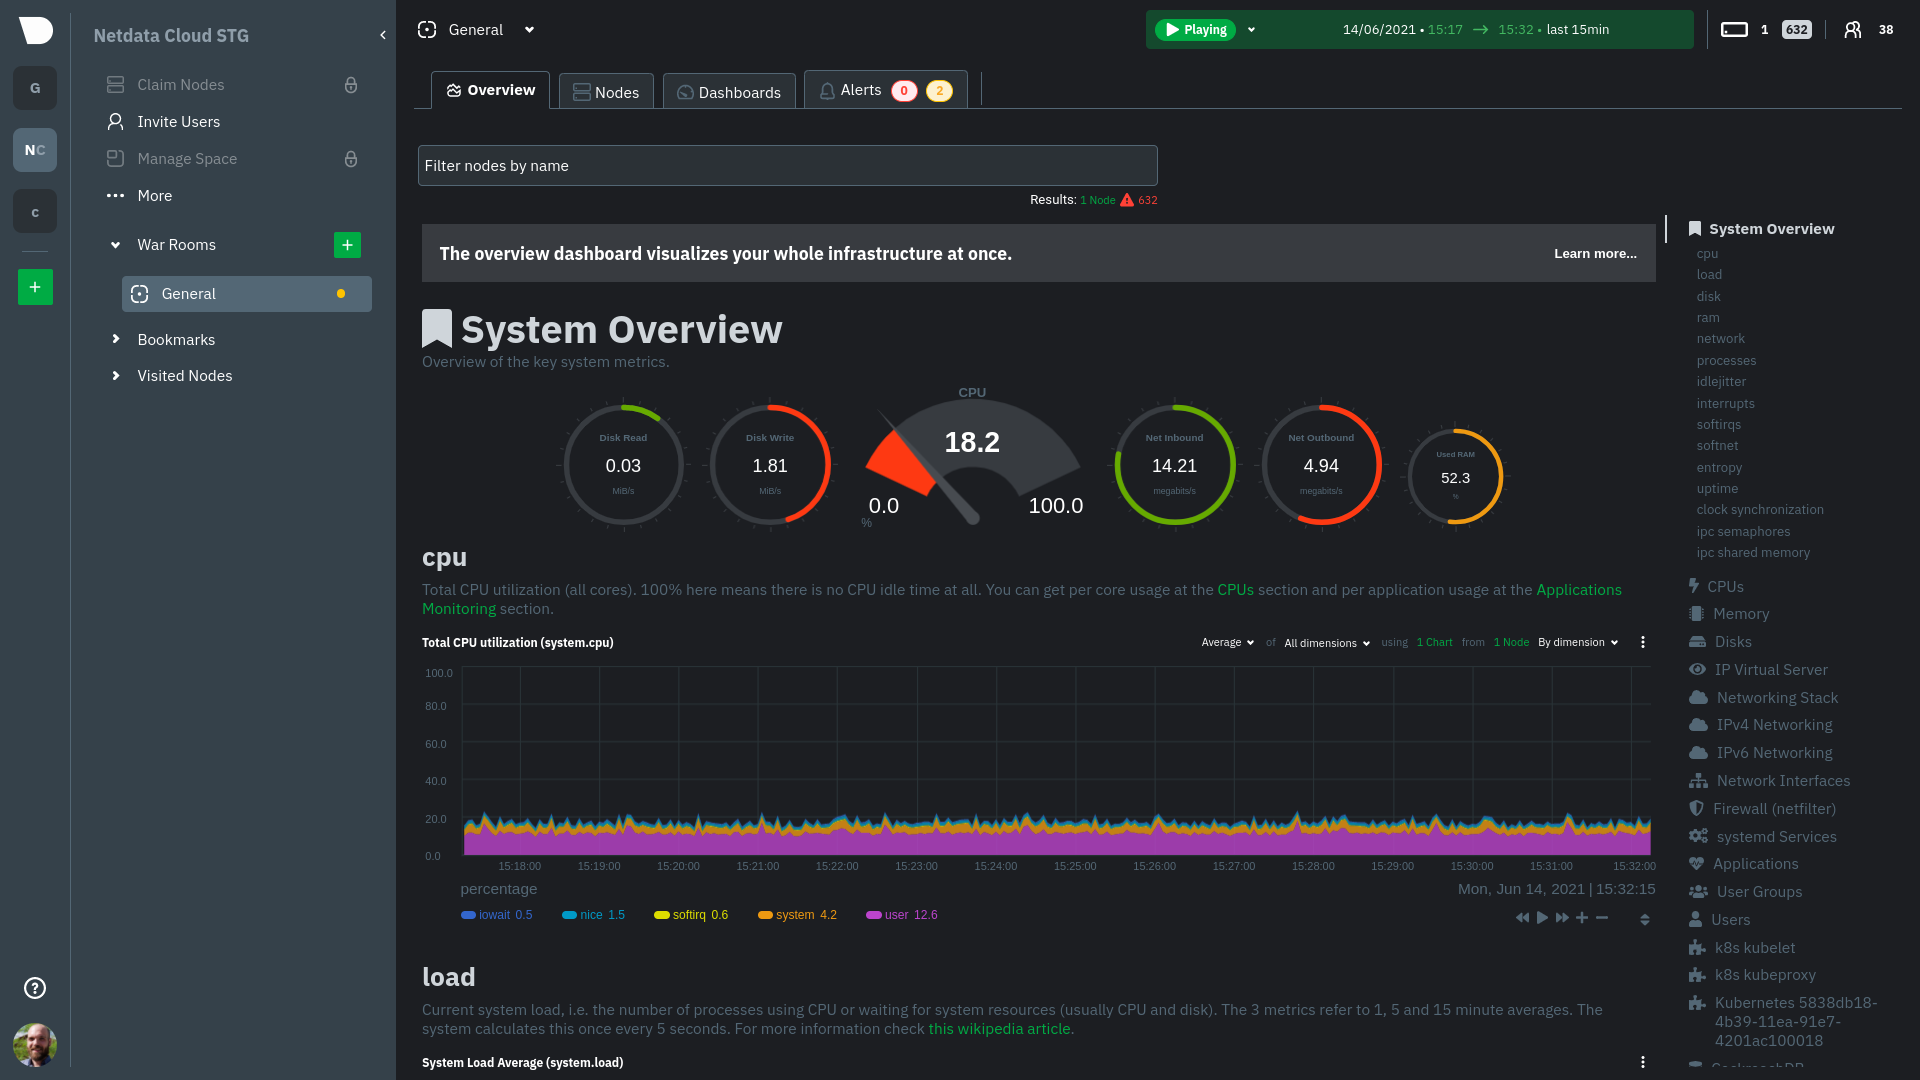
The default view for any War Room is the Overview, which uses composite charts to display real-time metrics from every available node in a given War Room. The Nodes view helps you view key metrics and alarm status from all your nodes at a glance. Finally, use Dashboards to build rich, targeted interfaces for your infrastructure using any number of charts from any number of nodes.
To switch between dashboards, use the tabs beneath the War Room's name. You can also jump to single-node dashboards from either the Overview or the Nodes view.
War Room tabs
If you open a new dashboard or jump to a single-node dashboard, they will open in a new War Room tab.
Tabs can be rearranged with drag-and-drop or closed with the X button. Open tabs persist between sessions, so you can always come right back to your preferred setup.
Play, pause, force play, and timeframe selector
A War Room has three different states: playing, paused, and force playing. The default playing state refreshes charts every second as long as the browser tab is in focus. Interacting with a chart pauses the War Room. Once the tab loses focus, charts pause automatically.
The top navigation bar features a play/pause button to quickly change the state, and a dropdown to select Force Play, which keeps charts refreshing, potentially at the expense of system performance.
Next to the play/pause button is the timeframe selector, which helps you select a precise window of metrics data to visualize. By default, all visualizations in Netdata Cloud show the last 15 minutes of metrics data.
Use the Quick Selector to visualize metrics from predefined timeframes, or use the input field below to enter a number and an appropriate unit of time. The calendar allows you to select multiple days of metrics data.
Click Apply to re-render all visualizations with new metrics data streamed to your browser from each distributed node. Click Clear to remove any changes and apply the default 15-minute timeframe.
The fields beneath the calendar display the beginning and ending timestamps your selected timeframe.
Indicators
Every War Room features two indicators: nodes and users.
The nodes indicator displays the number of active (transparent) and unreachable (gray) nodes. Click on either of them to open a dropdown with their hostnames, status when relevant, and a link to open a single-node dashboard.
The users indicator shows the number of users in the War Room. Clicking on it opens a modal to manage the War Room's users.
Node filter
The node filter allows you to quickly filter the nodes visualized in a War Room's views. It appears on the Overview and Nodes view, but not on single-node dashboards or new dashboards you might have created.

Use relational operators (==, !=, contains, and !contains) and logical operators (AND, OR), plus the name, OS, or services running on your nodes to quickly turn any War Room into a focused troubleshooting interface. See what services Netdata Cloud can filter by in the supported collectors list.
For example, name == centos OR os == debian filters any nodes by the exact name centos or has Debian as its
operating system.
You can also use parentheses around operators to create more sophisticated filters. (name contains aws AND os contains
ubuntu) OR services == apache shows only nodes that have aws in the hostname and are Ubuntu-based, or any nodes that
have an Apache webserver running on them.
If a filter is invalid or incomplete, Netdata Cloud shows a warning and will not run the filter until it's corrected.
War Room organization
We recommend a few strategies for organizing your War Rooms.
Service, purpose, location, etc.: You can group War Rooms by a service (think Nginx, MySQL, Pulsar, and so on), their purpose (webserver, database, application), their physical location, whether they're baremetal or a Docker container, the PaaS/cloud provider it runs on, and much more. This allows you to see entire slices of your infrastructure by moving from one War Room to another.
End-to-end apps/services: If you have a user-facing SaaS product, or an internal service that said product relies on, you may want to monitor that entire stack in a single War Room. This might include Kubernetes clusters, Docker containers, proxies, databases, web servers, brokers, and more. End-to-end War Rooms are valuable tools for ensuring the health and performance of your organization's essential services.
Incident response: You can also create new War Rooms as one of the first steps in your incident response process.
For example, you have a user-facing web app that relies on Apache Pulsar for a message queue, and one of your nodes
using the Pulsar collector begins reporting a suspiciously low
messages rate. You can create a War Room called $year-$month-$day-pulsar-rate, add all your Pulsar nodes in addition
to nodes they connect to, and begin diagnosing the root cause in a War Room optimized for getting to resolution as fast
as possible.
Add War Rooms
If you're the administrator of a Space, add new War Rooms to any Space by clicking on the green plus icon + next the War Rooms heading.

In the panel, give the War Room a name and description, and choose whether it's public or private. Anyone in your Space can join public War Rooms, but can only join private War Rooms with an invitation.
Manage War Rooms
If you're an administrator of War Room, you can change its settings. Click on the War Room's name in the top navigation to open a dropdown of options.

To change a War Room's name, description, or public/private status, click on Manage War Room.
To add a connected node to a War Room, click on Add Nodes. Choose any connected node you want to add to this War Room by clicking on the checkbox next to its hostname, then click + Add at the top of the panel.
To view or remove nodes in a War Room, click on List Nodes. To remove a node from the curernt War Room, click on the 🗑 icon. Removing a node from a War Room does not remove it from your Space.
To add existing users to a War Room, click on Add Users. See our invite doc for details on inviting new users to your Space in Netdata Cloud.
To list users in a War Room, click on List Users. You can also add new users with the + button.
What's next?
Once you've figured out an organizational structure that works for your team, learn more about how you can use Netdata Cloud to monitor distributed nodes using real-time composite charts.
Was this page helpful?
Need further help?
Search for an answer in our community forum.
Contribute
- Join our community forum
- Learn how to contribute to Netdata's open-source project
- Submit a feature request