View active health alarms
Every Netdata Agent comes with hundreds of pre-installed health alarms designed to notify you when an anomaly or performance issue affects your node or the applications it runs.
Netdata Cloud
A War Room's alarms indicator displays the number of
active critical (red) and warning (yellow) alerts for the nodes in this War Room. Click on either the critical or
warning badges to open a pre-filtered modal displaying only those types of active
alarms.
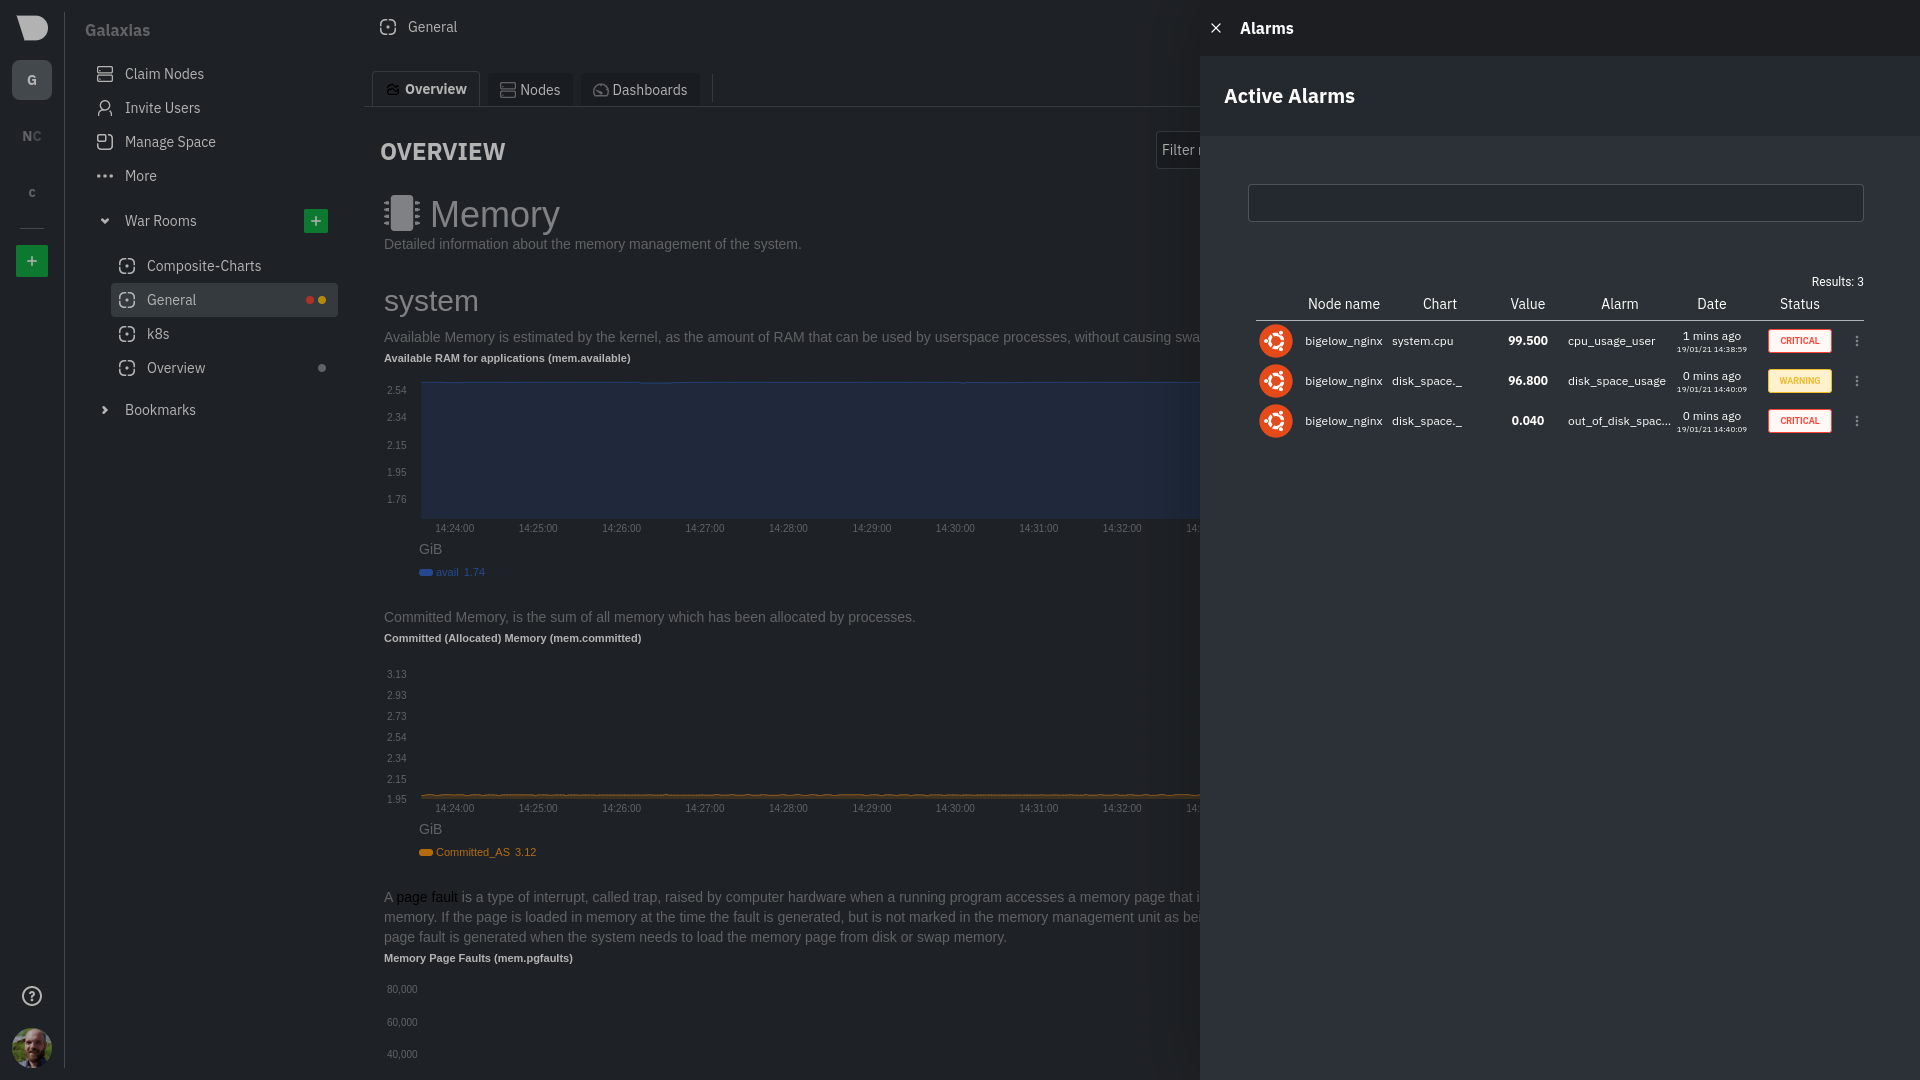
The Alarms panel lists all active alarms for nodes within that War Room, and tells you which chart triggered the alarm, what that chart's current value is, the alarm that triggered it, and when the alarm status first began.
Use the input field in the Alarms panel to filter active alarms. You can sort by the node's name, alarm, status, chart that triggered the alarm, or the operating system. Read more about the filtering syntax to build valuable filters for your infrastructure.
Click on the 3-dot icon (⋮) to view active alarm information or navigate directly to the offending chart in that
node's Cloud dashboard with the Go to chart button.
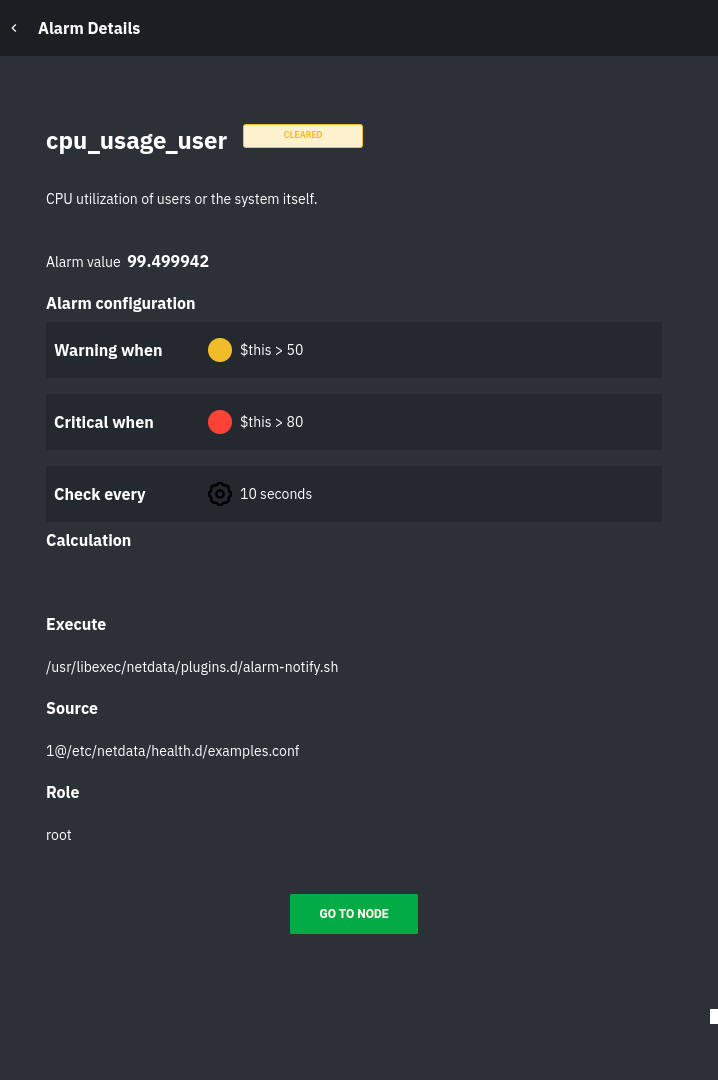
The active alarm information gives you details about the alarm that's been triggered. You can see the alarm's configuration, how it calculates warning or critical alarms, and which configuration file you could edit on that node if you want to tweak or disable the alarm to better suit your needs.
Local Netdata Agent dashboard
Find the alarms icon ![]() in the top navigation to bring up a modal that shows currently raised alarms, all running alarms, and the alarms log.
Here is an example of a raised
in the top navigation to bring up a modal that shows currently raised alarms, all running alarms, and the alarms log.
Here is an example of a raised system.cpu alarm, followed by the full list and alarm log:

And a static screenshot of the raised CPU alarm:

The alarm itself is named system - cpu, and its context is system.cpu. Beneath that is an auto-updating badge that
shows the latest value of the chart that triggered the alarm.
With the three icons beneath that and the role designation, you can:
- Scroll to the chart associated with this raised alarm.
- Copy a link to the badge to your clipboard.
- Copy the code to embed the badge onto another web page using an
<embed>element.
The table on the right-hand side displays information about the health entity that triggered the alarm, which you can use as a reference to configure alarms.
What's next?
With the information that appears on Netdata Cloud and the local dashboard about active alarms, you can configure alarms to match your infrastructure's needs or your team's goals.
If you're happy with the pre-configured alarms, skip ahead to enable notifications to use Netdata Cloud's centralized alarm notifications and/or per-node notifications to endpoints like Slack, PagerDuty, Twilio, and more.
Was this page helpful?
Need further help?
Search for an answer in our community forum.
Contribute
- Join our community forum
- Learn how to contribute to Netdata's open-source project
- Submit a feature request