Detect anomalies in systems and applications
Beginning with v1.27, the open-source Netdata Agent is capable of unsupervised anomaly detection with machine learning (ML). As with all things Netdata, the anomalies collector comes with preconfigured alarms and instant visualizations that require no query languages or organizing metrics. You configure the collector to look at specific charts, and it handles the rest.
Netdata's implementation uses a handful of functions in the Python Outlier Detection (PyOD)
library, which periodically runs a train function that learns what
"normal" looks like on your node and creates an ML model for each chart, then utilizes the
predict_proba() and
predict() PyOD functions to
quantify how anomalous certain charts are.
All these metrics and alarms are available for centralized monitoring in Netdata Cloud. If you choose to sign up for Netdata Cloud and connect your nodes, you will have the ability to run tailored anomaly detection on every node in your infrastructure, regardless of its purpose or workload.
In this guide, you'll learn how to set up the anomalies collector to instantly detect anomalies in an Nginx web server and/or the node that hosts it, which will give you the tools to configure parallel unsupervised monitors for any application in your infrastructure. Let's get started.
Prerequisites
- A node running the Netdata Agent. If you don't yet have that, get Netdata.
- A Netdata Cloud account. Sign up if you don't have one already.
- Familiarity with configuring the Netdata Agent with
edit-config. - Optional: An Nginx web server running on the same node to follow the example configuration steps.
Install required Python packages
The anomalies collector uses a few Python packages, available with pip3, to run ML training. It requires
numba, scikit-learn,
pyod, in addition to
netdata-pandas, which is a package built by the Netdata team to pull data
from a Netdata Agent's API into a Pandas. Read more about netdata-pandas on its package
repo or in Netdata's community
repo.
# Become the netdata user
sudo su -s /bin/bash netdata

# Install required packages for the netdata user
pip3 install --user netdata-pandas==0.0.38 numba==0.50.1 scikit-learn==0.23.2 pyod==0.8.3
If the
pip3command fails, you need to install it. For example, on an Ubuntu system, usesudo apt install python3-pip.
Use exit to become your normal user again.
Enable the anomalies collector
Navigate to your Netdata config directory and use edit-config
to open the python.d.conf file.
sudo ./edit-config python.d.conf
In python.d.conf file, search for the anomalies line. If the line exists, set the value to yes. Add the line
yourself if it doesn't already exist. Either way, the final result should look like:
anomalies: yes
Restart the Agent with sudo systemctl restart netdata, or the appropriate
method for your system, to start up the anomalies collector. By default, the
model training process runs every 30 minutes, and uses the previous 4 hours of metrics to establish a baseline for
health and performance across the default included charts.
💡 The anomaly collector may need 30-60 seconds to finish its initial training and have enough data to start generating anomaly scores. You may need to refresh your browser tab for the Anomalies section to appear in menus on both the local Agent dashboard or Netdata Cloud.
Configure the anomalies collector
Open python.d/anomalies.conf with edit-conf.
sudo ./edit-config python.d/anomalies.conf
The file contains many user-configurable settings with sane defaults. Here are some important settings that don't involve tweaking the behavior of the ML training itself.
charts_regex: Which charts to train models for and run anomaly detection on, with each chart getting a separate model.charts_to_exclude: Specific charts, selected by the regex incharts_regex, to exclude.train_every_n: How often to train the ML models.train_n_secs: The number of historical observations to train each model on. The default is 4 hours, but if your node doesn't have historical metrics going back that far, consider changing the metrics retention policy or reducing this window.custom_models: A way to define custom models that you want anomaly probabilities for, including multi-node or streaming setups.
⚠️ Setting
charts_regexwith many charts ortrain_n_secsto a very large number will have an impact on the resources and time required to train a model for every chart. The actual performance implications depend on the resources available on your node. If you plan on changing these settings beyond the default, or what's mentioned in this guide, make incremental changes to observe the performance impact. Consideringtrain_max_nto cap the number of observations actually used to train on.
Run anomaly detection on Nginx and log file metrics
As mentioned above, this guide uses an Nginx web server to demonstrate how the anomalies collector works. You must configure the collector to monitor charts from the Nginx and web log collectors.
charts_regex allows for some basic regex, such as wildcards (*) to match all contexts with a certain pattern. For
example, system\..* matches with any chart with a context that begins with system., and ends in any number of other
characters (.*). Note the escape character (\) around the first period to capture a period character exactly, and
not any character.
Change charts_regex in anomalies.conf to the following:
charts_regex: 'system\..*|nginx_local\..*|web_log_nginx\..*|apps.cpu|apps.mem'
This value tells the anomaly collector to train against every system. chart, every nginx_local chart, every
web_log_nginx chart, and specifically the apps.cpu and apps.mem charts.
Remove some metrics from anomaly detection
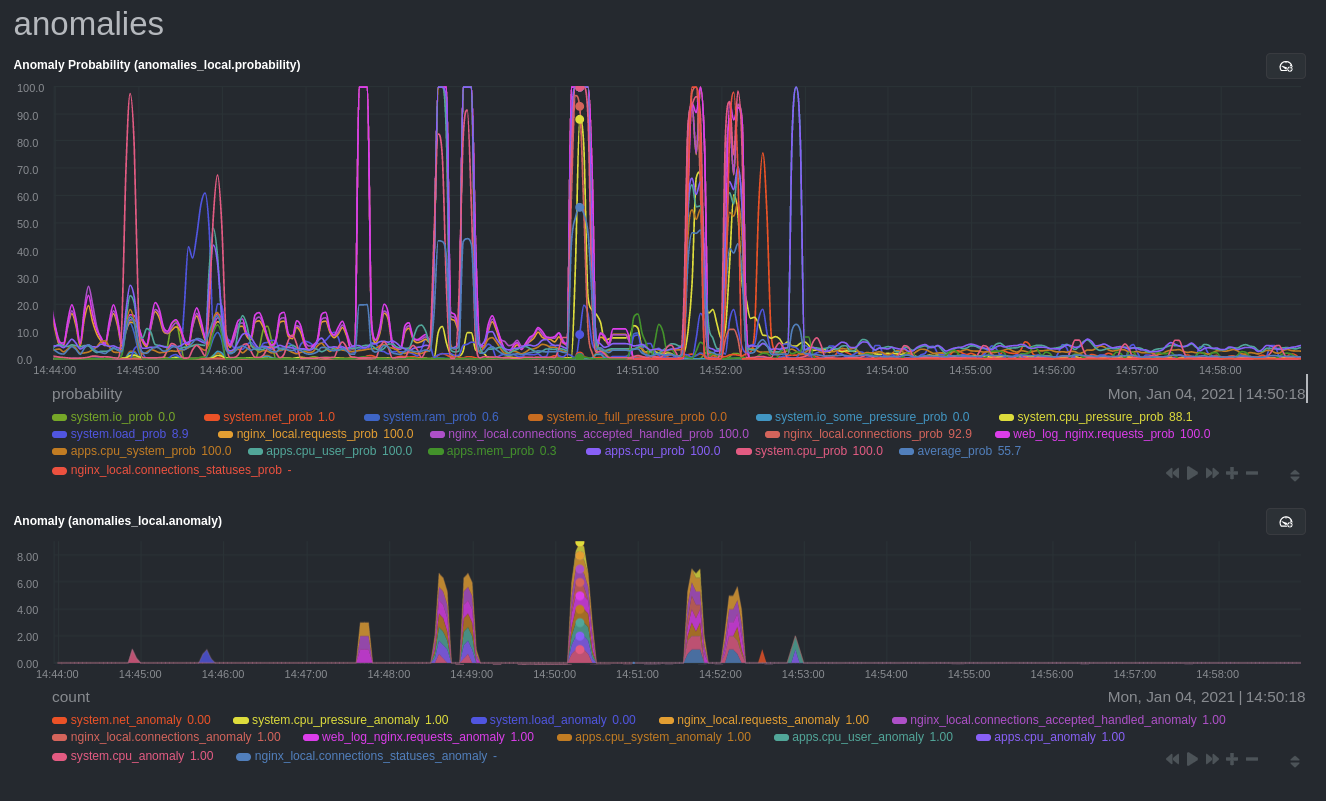
As you can see in the above screenshot, this node is now looking for anomalies in many places. The result is a single
anomalies_local.probability chart with more than twenty dimensions, some of which the dashboard hides at the bottom of
a scrollable area. In addition, training and analyzing the anomaly collector on many charts might require more CPU
utilization that you're willing to give.
First, explicitly declare which system. charts to monitor rather than of all of them using regex (system\..*).
charts_regex: 'system\.cpu|system\.load|system\.io|system\.net|system\.ram|nginx_local\..*|web_log_nginx\..*|apps.cpu|apps.mem'
Next, remove some charts with the charts_to_exclude setting. For this example, using an Nginx web server, focus on the
volume of requests/responses, not, for example, which type of 4xx response a user might receive.
charts_to_exclude: 'web_log_nginx.excluded_requests,web_log_nginx.responses_by_status_code_class,web_log_nginx.status_code_class_2xx_responses,web_log_nginx.status_code_class_4xx_responses,web_log_nginx.current_poll_uniq_clients,web_log_nginx.requests_by_http_method,web_log_nginx.requests_by_http_version,web_log_nginx.requests_by_ip_proto'
Apply the ideas behind the collector's regex and exclude settings to any other system, container, or application metrics you want to detect anomalies for.
What's next?
Now that you know how to set up unsupervised anomaly detection in the Netdata Agent, using an Nginx web server as an example, it's time to apply that knowledge to other mission-critical parts of your infrastructure. If you're not sure what to monitor next, check out our list of collectors to see what kind of metrics Netdata can collect from your systems, containers, and applications.
Keep on moving to part 2, which covers the charts and alarms Netdata creates for unsupervised anomaly detection.
For a different troubleshooting experience, try out the Metric Correlations feature in Netdata Cloud. Metric Correlations helps you perform faster root cause analysis by narrowing a dashboard to only the charts most likely to be related to an anomaly.
Related reference documentation
Was this page helpful?
Need further help?
Search for an answer in our community forum.
Contribute
- Join our community forum
- Learn how to contribute to Netdata's open-source project
- Submit a feature request